Table of Performance Values[]
Regression Analysis[]
The following table provides the values of the constraints under which regression analysis of the performance data was performed:
| Value | Units | |
|---|---|---|
| Primary array | 9,999,999 | Cells |
| Secondary array | 7,506,386 | Items |
| Key length | 1 to 8 | Digits |
| Setup time[1] | 4.265 | Seconds |
| Sort time[2] | 1.485 | Seconds |
| Total Ratio | .3482 | Percent |
Class Determination[]
Class notated sort routines are categorized according to the Chi Square analysis of linear (L), parabolic {P), logarithmic (Ln) and exponential (E) best fit regression analysis applied to their performance data produced under a specified set of constraints. Class notation is used in preference to Theta notation, a form of Big O notation, since the advantage Class notation offers is to provide the values of the equation parameters obtained from regression analysis of the performance data such as in the case of a linear equation best Chi Square fit of the value for slope (or seconds per item) in the case of a Class L (linear equation) category best fit. This additional information allows the programmer or user to select the best sort routine for his own application based upon the actual number of items which must be sorted per unit time or the time limit to sort a specific number of items. Since the Check sort performance best fits the Class L category the values for slope m and constant c for the linear equation f(x)= m*x+c can be determined by a best fit linear regression analysis and provided in the table below:
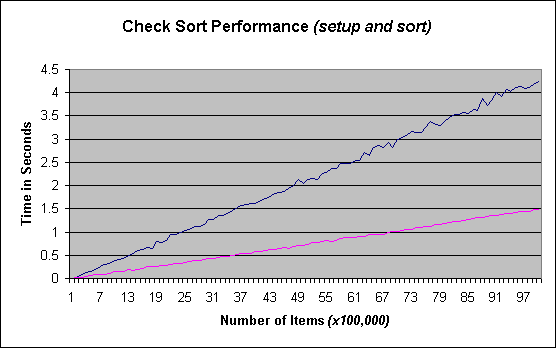
"Blue is setup time, Magenta is sort time."
| Routine | Slope | c |
|---|---|---|
| Setup | 0.043007516 | 0 |
| Sort | 0.014943042 | 0 |
This method of representation allows performance to be projected for any number of items or time limit on other machines under the assumption that setup and sort ratios will not change. A projection of sort routine performance for any machine can therefore be made using the time required to initialize an array by calculating the ratio of sort time to setup time (which in this case is or .34745) or a percentage value of 34.745%. Thus on a machine providing a setup time of 2,325,175 items per second the projected sort time would be .34745 seconds per item or the ability to sort 6,692,078 items per second.
